Build an app within the monday.com platform that can help teams and organizations take an active role in combating climate change.
Goals
We want our users to have fun and become more conscientious with their sustainability habits doing everyday tasks.
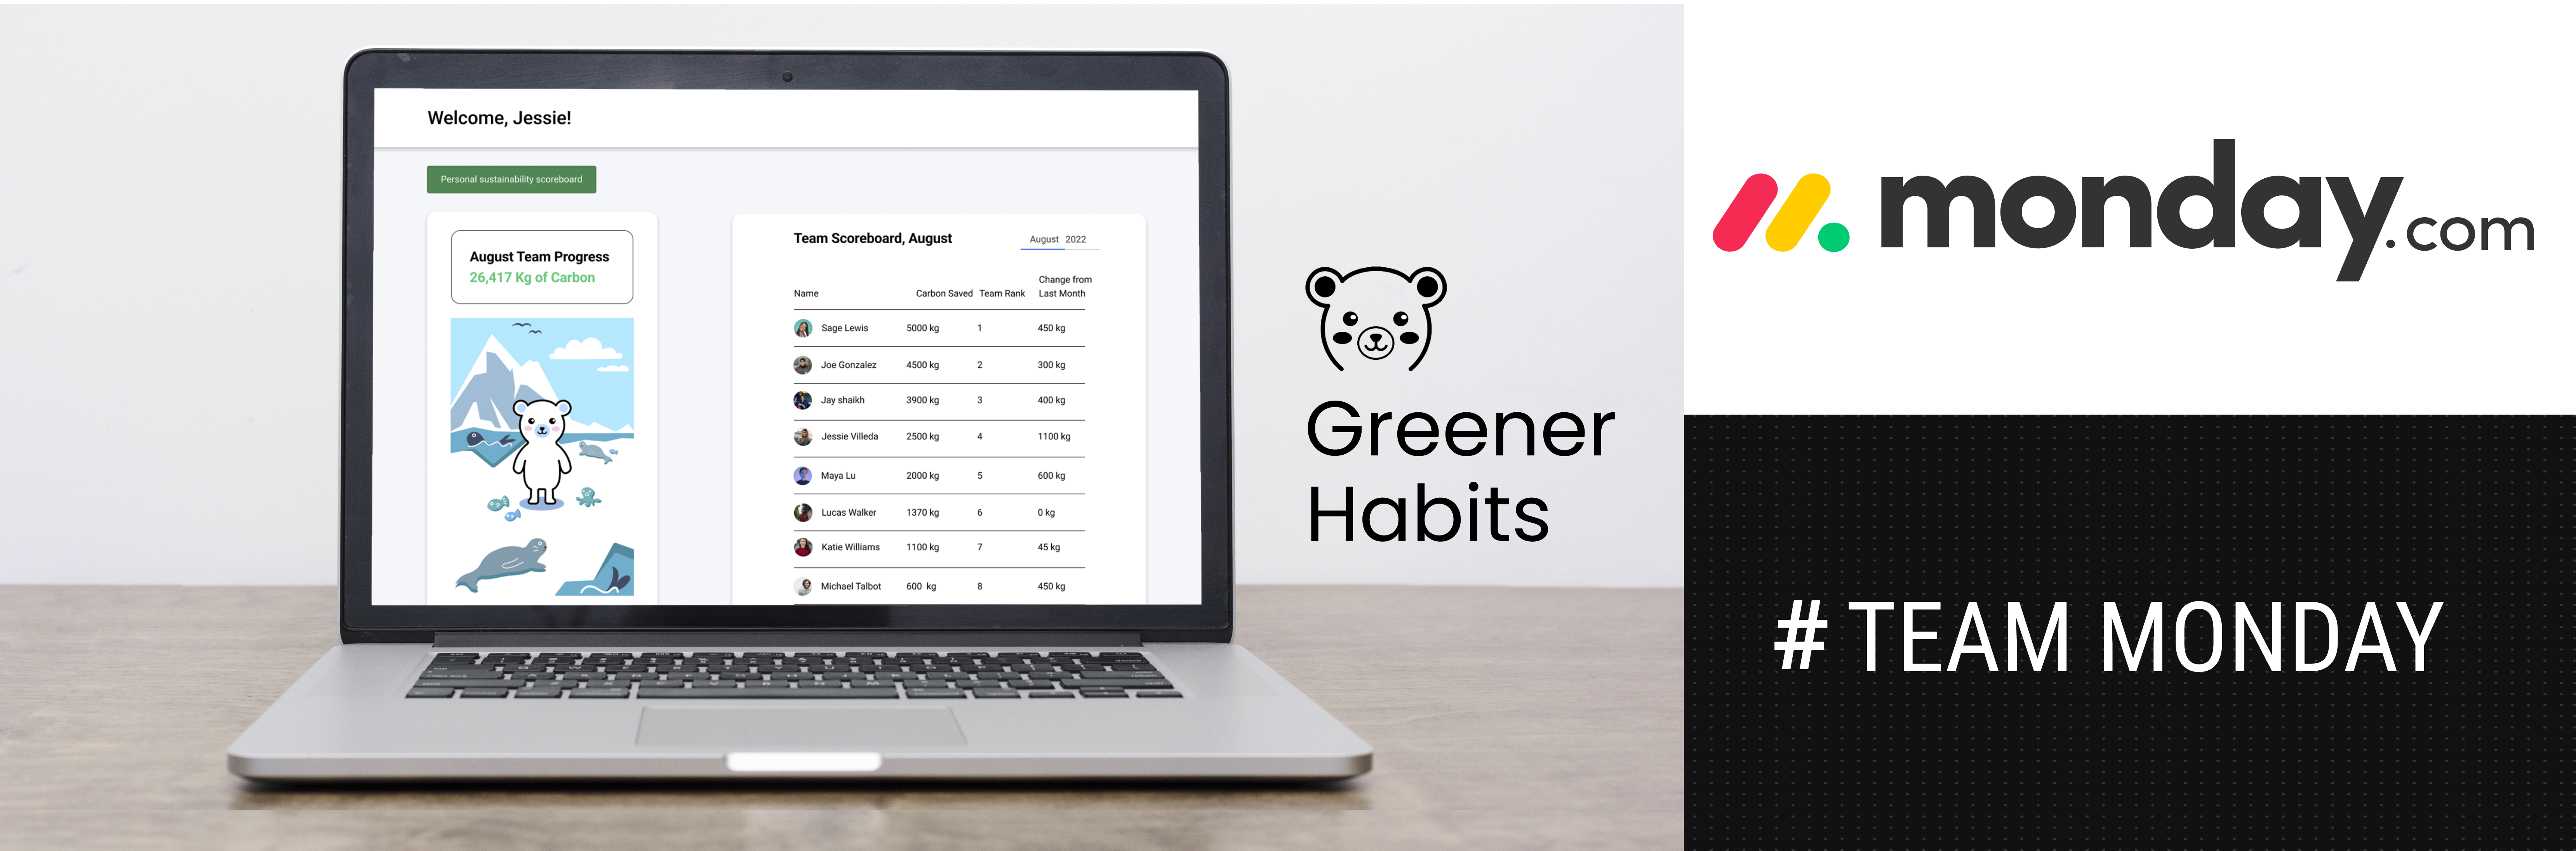
What is Greener Habits?
A tool to help users learn which actions to take to reduce their carbon footprints, track progress, earn rewards, and encourage friendly competition within their teams.
Solution
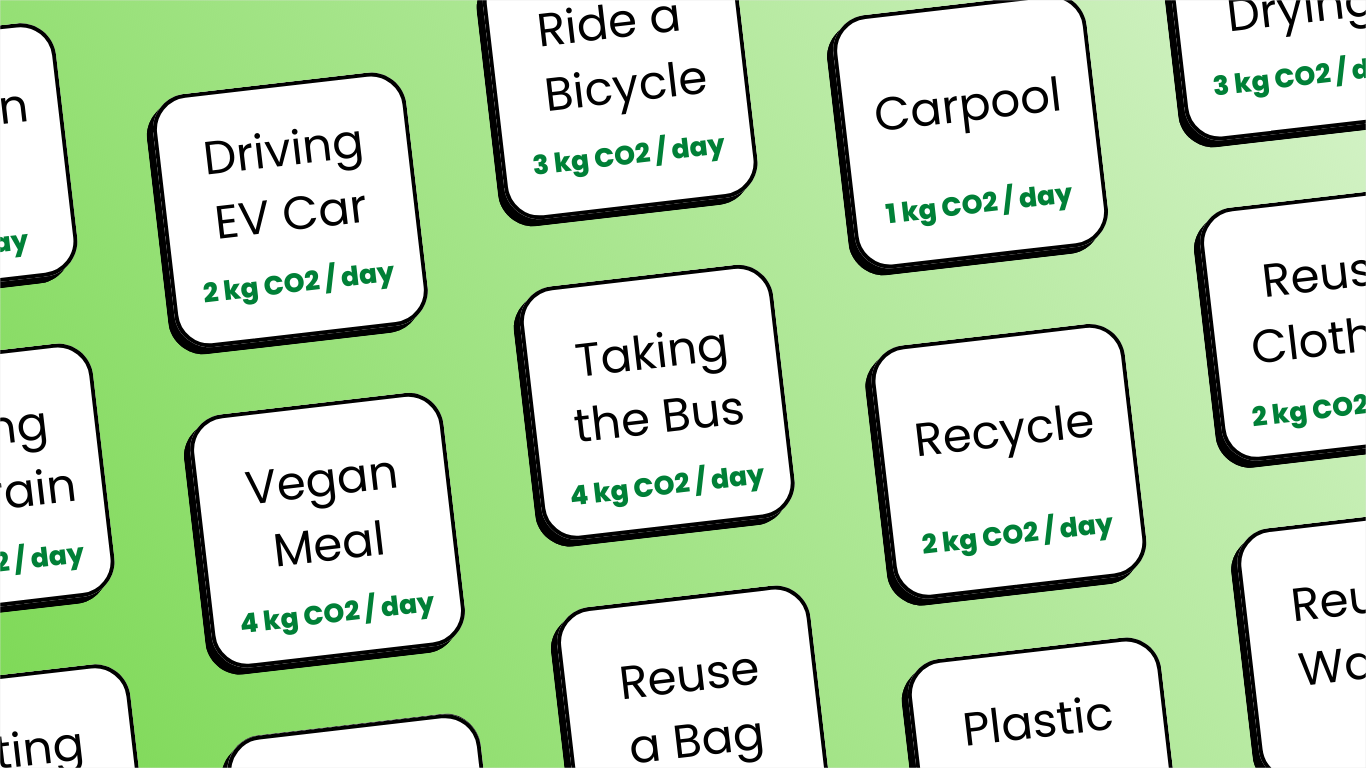
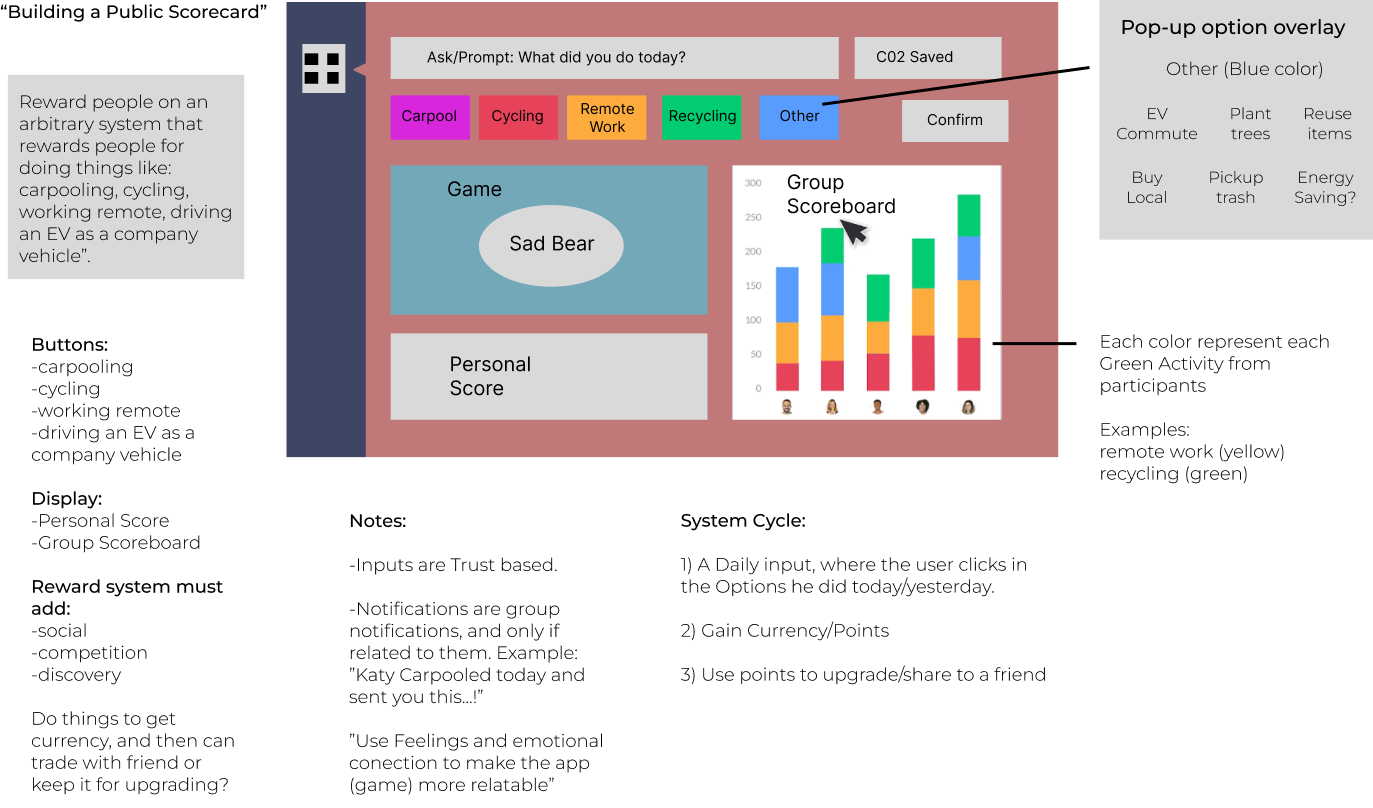
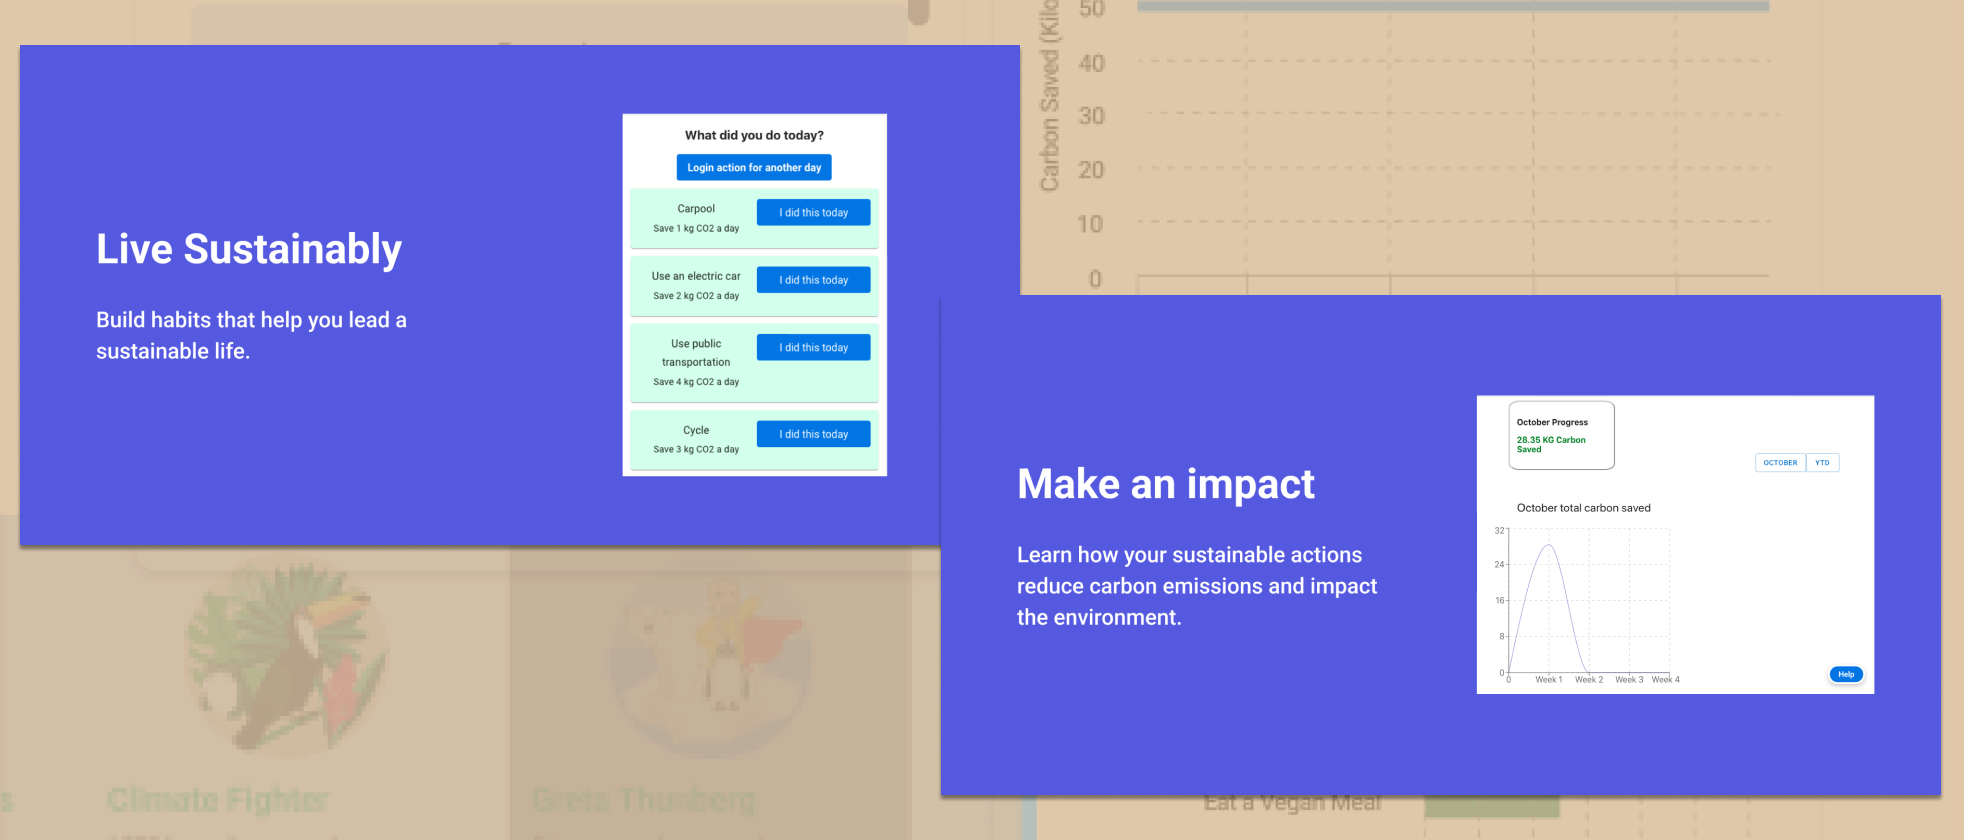
Createagamified C02 tracker where the user selects the tasks for the day while the app tracks how much C02 that task saved and compare results with other team members to earn badges.
The app is built to be used for no more than 15 minutes, so it can easily fit into their work schedule before, or after jumping on their monday.com routine.
How it all Began...
Looking to work on and get more experience on a design team, I saw a posting by a group member, which piqued my interest, to work on a Hackathon (Climate Change App Challenge) for monday.com and their users.
The project itself was to build an app that can help teams and organizations take an active role in combating climate change.
The group of volunteers consisted of 10+ like-minded people located around the world with various disciplinary backgrounds who shared a common interest in design and technology
We first had to decide on a topic that would appeal to users and we decided on Reducing Carbon Emissions with Everyday Tasks.
Individuals were grouped to tackle various tasks for the initial research: competitive analysis, surveys, and interviews to gather more information for the project.
Research
During the discovery phase, we performed a Competitive Analysis just to see how other apps on this subject matter execute their content, what is missing, and how it is shared to users in a way that is informative yet interesting and fun. We saw a gamification opportunity and decided to take this app in that direction.
We got together to create a survey to send to prospects and interview a close person to learn more about their concerns, wants and needs as well as dedicated time and level of interest with this future carbon emissions application.
Survey Key Findings
Quantitative/Indirect
Social Media and Word of Mouth were used a tools to prospect.
PARTICIPANTS
0+
ACTIVE
72hrs
ECO-CONSCIOUS
50%
EMPLOYED
100%
AGED 24 - 34
32.0%
AGED 35 - 45
29.0%
Discovered:
Lack of guidance and information
Busy life and difficult to find information
Lack of understanding the impact of their actions
Can't be in the way of their daily routine
Participants
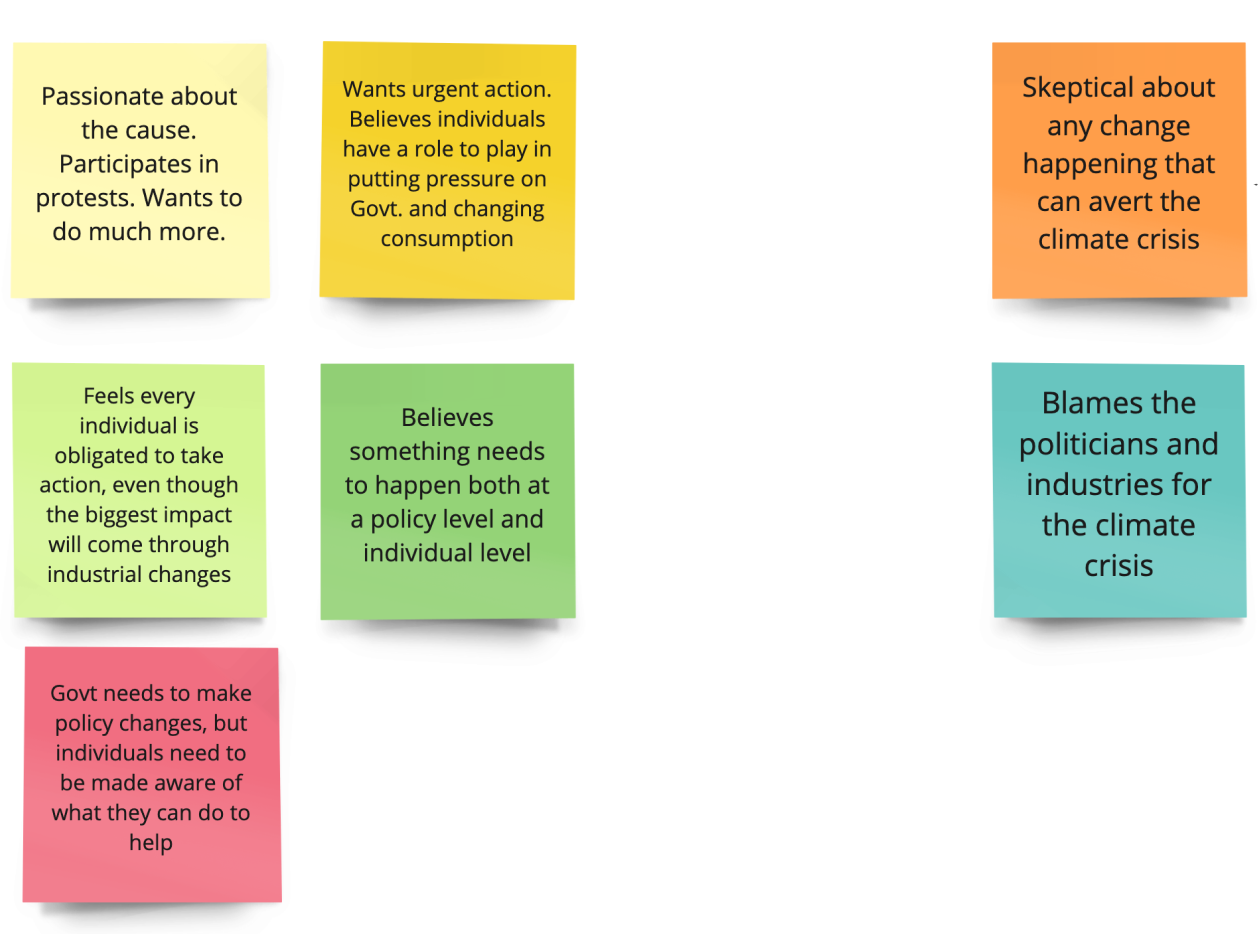
Interview Key Findings
Qualitative/Direct
A fellow designer and I went through the user interviews sticky notes and synthesized the findings into an affinity map to see if there were any recurring patterns and/or themes emerging.
*Post it Notes
Discovered:
General attitude Lack support from the Government or Big Companies
Generally people SAY that change can be made by: Companies with innovative solutions that support sustainability
Things they do in common (In order): Recycle Energy Saving Conscious Compsumption Reduce Transportation Pollution
The challenges people face are: Lack of understanding the impact of their actions
Solutions: Incentivize for actions
PARTICIPANTS
7
AVG. AGE
34.5
USA
80%
EUROPE
20%
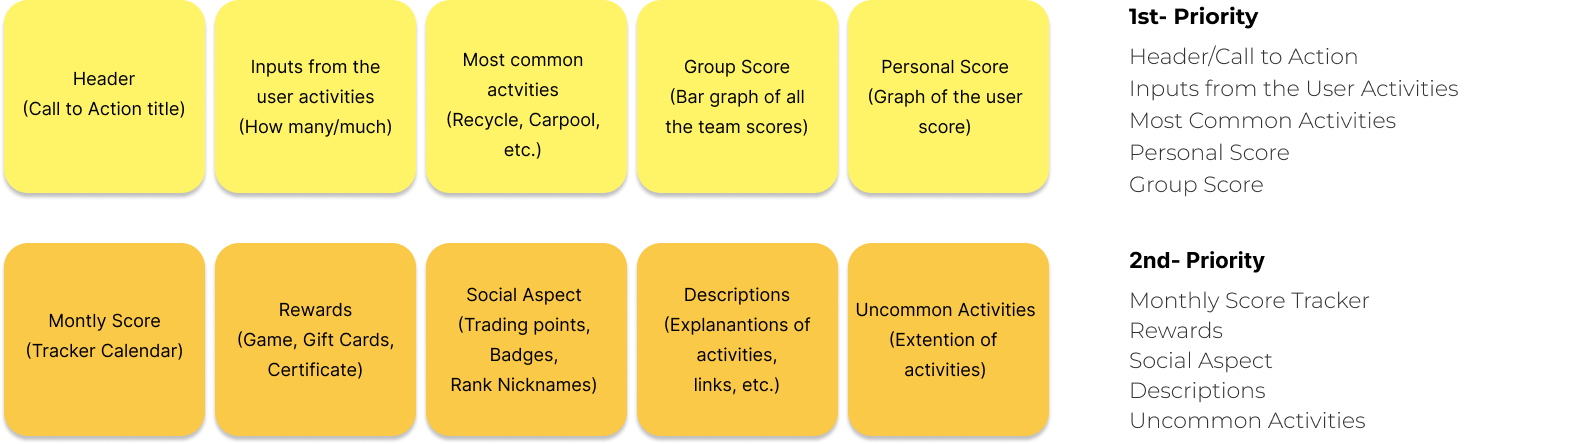
CARD SORTING
To dig a little deeper and get more insights into the general attitudes towards Climate Change, an open card sort research method was implemented to:
1) Help organize the content of the application
2) Have a better understand how users expect the site to work
3) Yield a significant amount of valuable data quickly
CATEGORIES
Hypothesis
The research gathered really helped gain insights to build the hypothesis:
How Might We
1) Motivate individuals to take action? [Competition amongst team members/Badges]
2) Assess the impact of sustainable action and communicate it? [Daily challenges/Tasks]
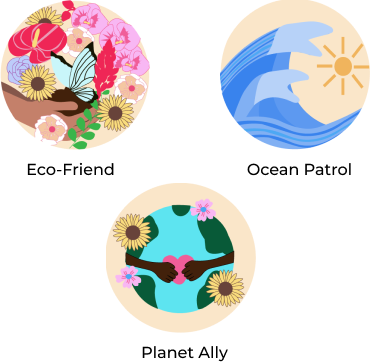
BADGES
Information Architecture
No IPA, No Problem
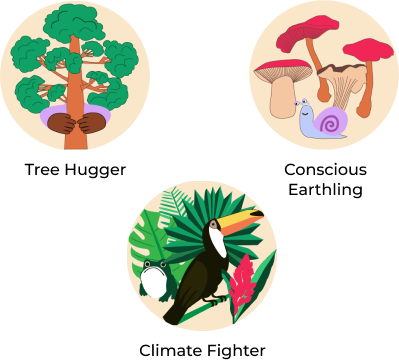
An Excel sheet was created for our database. Due to the fact that we had to work with equivalencies for greenhouse gases, the CO2 translated to KG of CO2 per day to give the user a reference.
Different sources use different variables... When looking for sources to reference, we found that there were some inconsistencies so we had to come up with our own calculations.
Research location affects the results…. Location skewed the results. For example, Rideshares (Carpooling) in the US shows less CO2 savings compared to the EU. So we decided to make this application US based.
Broad activities have way too many variables… There were too many variables. For example, when buying second hand, how much CO2 is being saved? What variables does one use to calculate clothes, furniture, or a mix of both (just to name a few)?
Savings overtime….. Because of time constraints, we had to show fixed numbers when an activity was tracked. An activity like Planting a Tree, will show instant results while saving 1ton of CO2.
Wireframes
Sketches
A preview to the prototype, I was part of the initial sketches that helped shaped the visual direction of the application. The group wanted to explore and explain design concepts with our fellow team members. Designed in Figma, this helped evaluate the feasibility of features and elimate layout and functionality issues.
Usability testing proved to be vital. Originally, we went into the direction of having a planet that is on fire but found that people were more drawn to endangered polar bears. We wanted users to be able to keep the polar bear from being sad and keep the polar bear happy with their daily tasks. By going into this direction, we were able to form mental models by using the psychological aspect.
Many iterations and feedback from usability tests led to this high fidelity prototype….
Retrospective
Impact & outcome
1) Users were more drawn to the gamification and competition aspect amongst colleagues increasing adoption and engagement by 30%.
2) 2 out of 5 users didn’t know their impact to climate change and how they can help reduce carbon emissions with daily tasks.
Greener Habits won the featured or editor’s choice category and $5K cash prize for the monday.com climate change app challenge.
Users were more drawn to the gamification and competition aspect amongst colleagues increasing adoption and engagement by 30%.
2 out of 5 users didn’t know their impact to climate change and how they can help reduce carbon emissions with daily tasks.
Greener Habits won the featured or editor’s choice category and $5K cash prize for the monday.com climate change app challenge.
Failures
We realized towards the end of the process, that we never had a live test. We only tested the app without connecting to the Monday.com servers, meaning that the app was only built and tested locally.
When we released the app we discovered errors when pulling information from the Monday.com servers. Example given, we building using HTTP instead of HTTPS, this meant that servers block our request for security reasons.
Accomplishments
Through consistent planning, design sprints, weekly meetings, and slack channels, we were able to build an end-to-end application from scratch.
Tackle a complicated problem and create an app that is user-friendly, and impactful given what we learned from speaking to employed people, researching the problem space, frequent user testing, and encouraging the cross pollination of ideas across the design and engineering teams.
What was learned
I came out of this hackathon learning a lot about the challenges of working with a team across timezones including what went well, what didn’t go well, and what can be done better next time. Communication and collaboration, specifically between design and engineering, are key to the success of a project.
What to improve
Further user-testing with monday.com users and to collect user feedback. Sometimes the brightest ideas can come directly from the users. We would love to speak and hear from existing monday.com users to help us further improve the app.